This Week’s Investment News In Six Charts
-

-

Published Friday, March 8, 2024 at: 9:12 PM EST
It was a big week for federal government data. Here are six charts encapsulating the latest news on economic fundamentals driving investment prices.
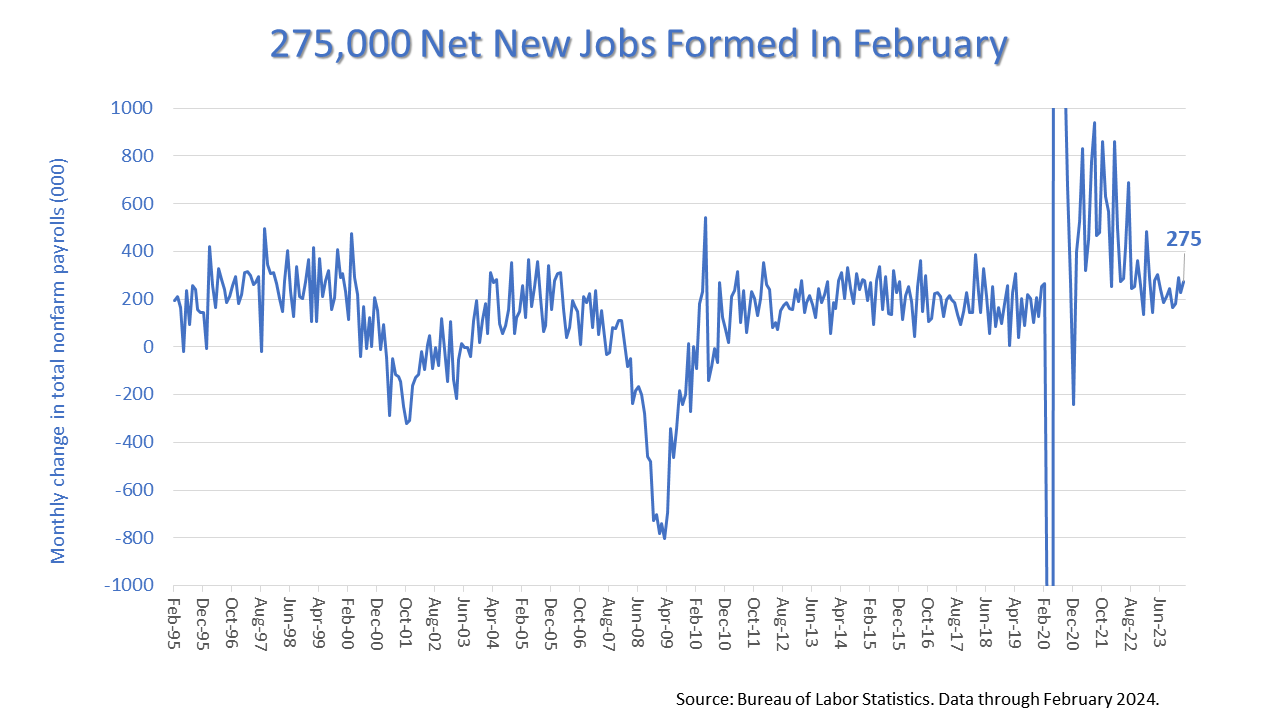
The U.S. economy grew by 275,000 new jobs in February, according to Friday’s report on the monthly job situation from the federal government. That’s more than the approximately 200,000 new jobs averaged during previous economic expansions. It also beat Wall Street analysts expectations.
Currently, the big worry for investors is that the Federal Reserve, which regulates loan rates, will maintain relatively high lending rates. So, in a way, the stronger than expected job creation is not such great news. However, creating 275,000 more new jobs than were lost in February, is comforting.
For every new job created, a new employee is added to the U.S. economy — read that as a new salaried consumer who will probably spend about 95% of their wages, thus growing the national prosperity.
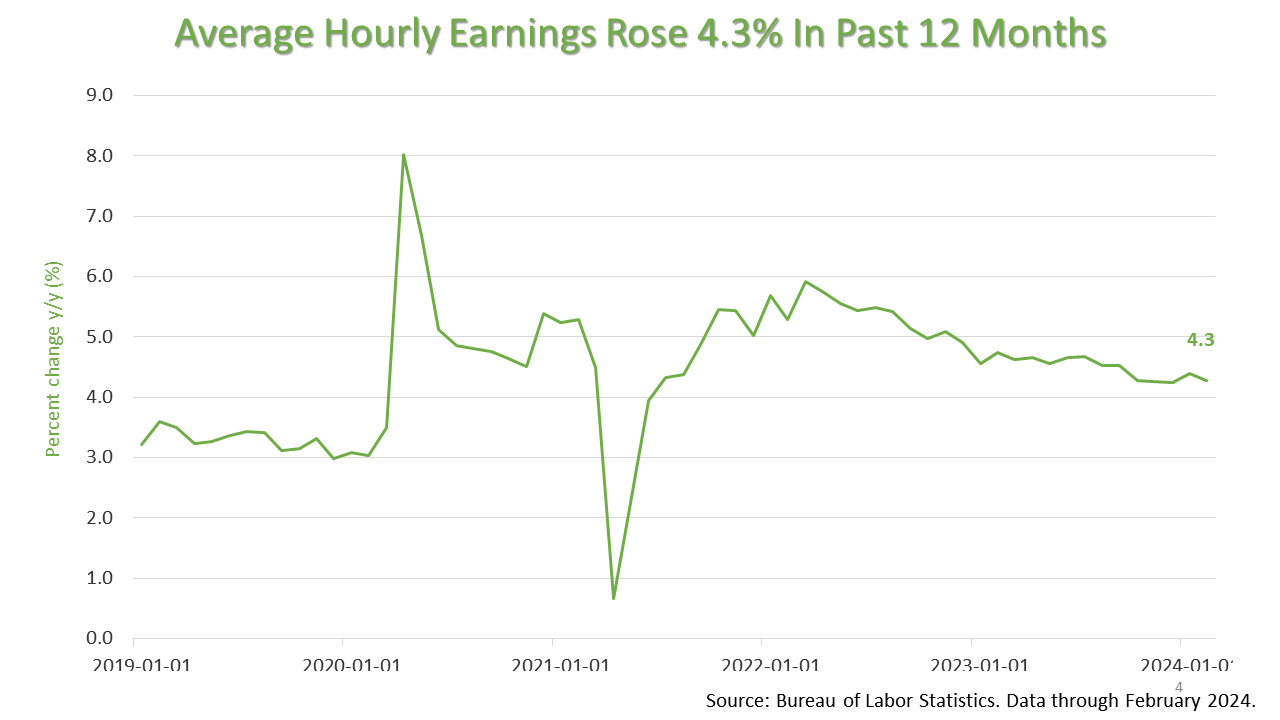
While job creation was surprisingly strong, average hourly wages declined again last month. The average hourly wage was 4.3% higher than a year ago, in the 12 months ended February 29, 2024. With the annual inflation rate at less than 3% currently, real wages after inflation are growing. That’s very good news. To be clear, American workers gained buying power in 2023.
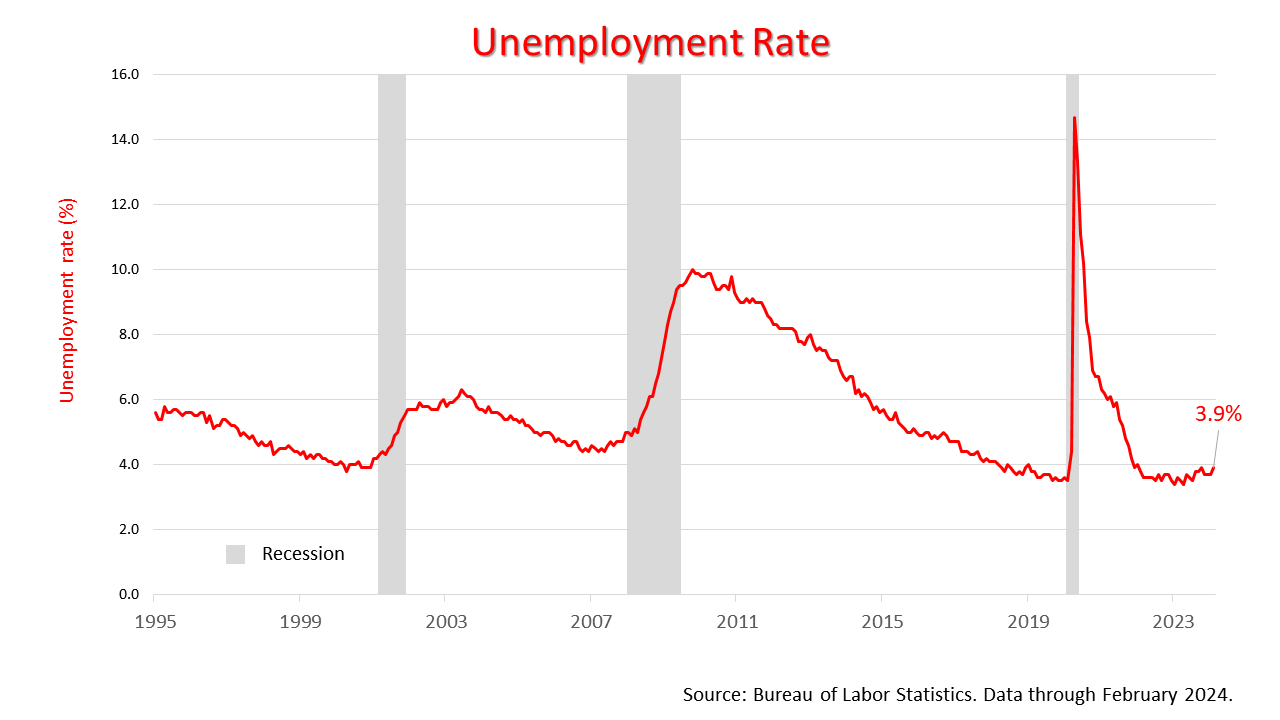
The unemployment rate ticked a tenth of 1% higher, to 3.9%, in February, but it is still near a 50-year low.
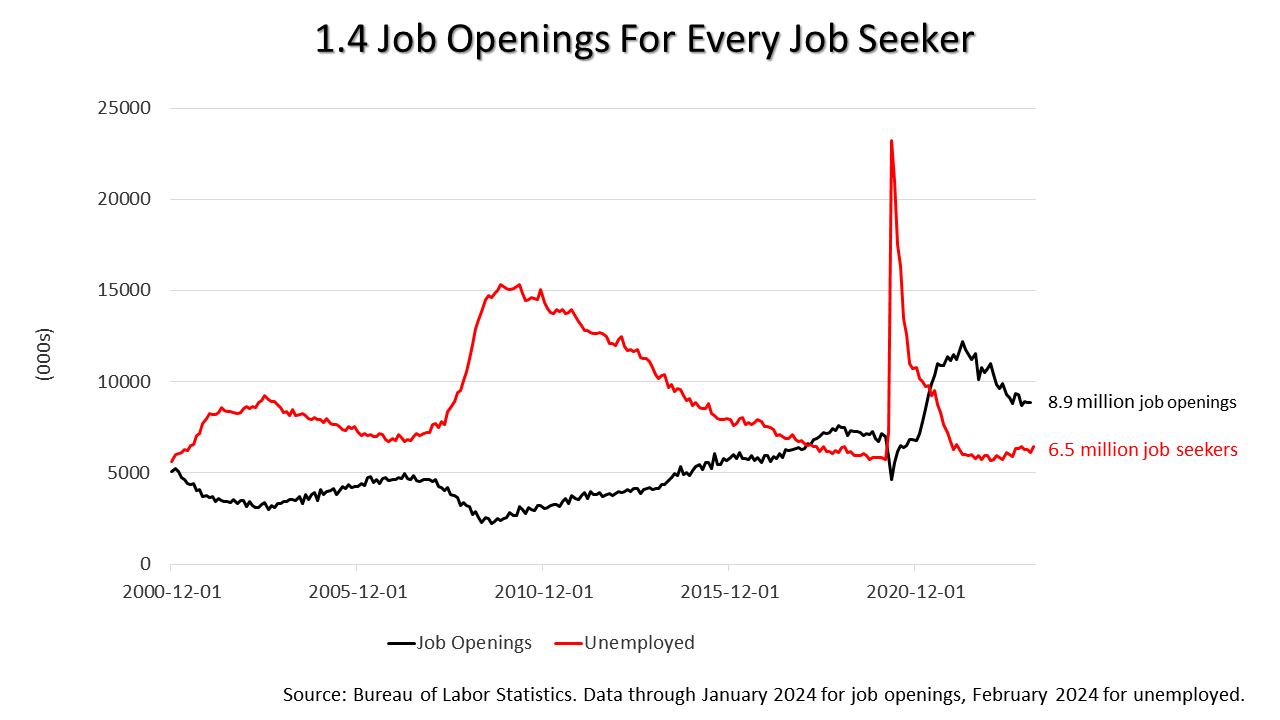
On Wednesday, the federal Job Openings and Labor Turnover Survey (JOLTS) report on job openings, hires, and separations showed 1.4 job openings are waiting to be filled for every unemployed job seeker. This is an unusual condition. Since the pandemic, the job market has been turned upside down, and job seekers have been outnumbered by job openings. That’s not normal, but the pandemic upended normalcy by reducing the number of workers in the economy.
As long the two data points in this chart are inverted, the U.S. will continue to see strong job formation, which leads to more consumers and more spending.
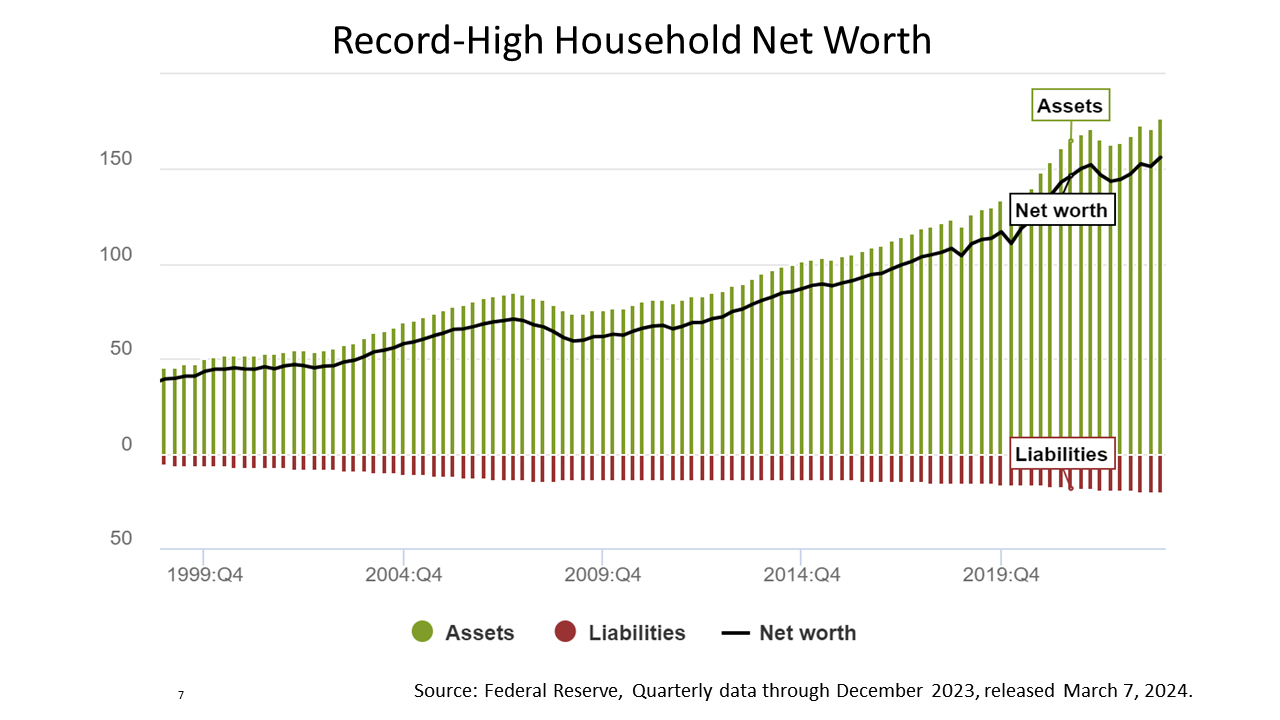
Finally, this chart shows that the average American household’s net worth soared to a record high in 2023. It was driven by gains in the stock market. Stronger household balance sheets inspires increased spending. The “wealth effect” makes people feel they can buy more stuff, and that grows the economy. This is a virtuous cycle, when stock share prices rise and that makes people feel wealthier and inspires them to spend more.. It’s could indicate a bubble is growing if it continues for a long period.
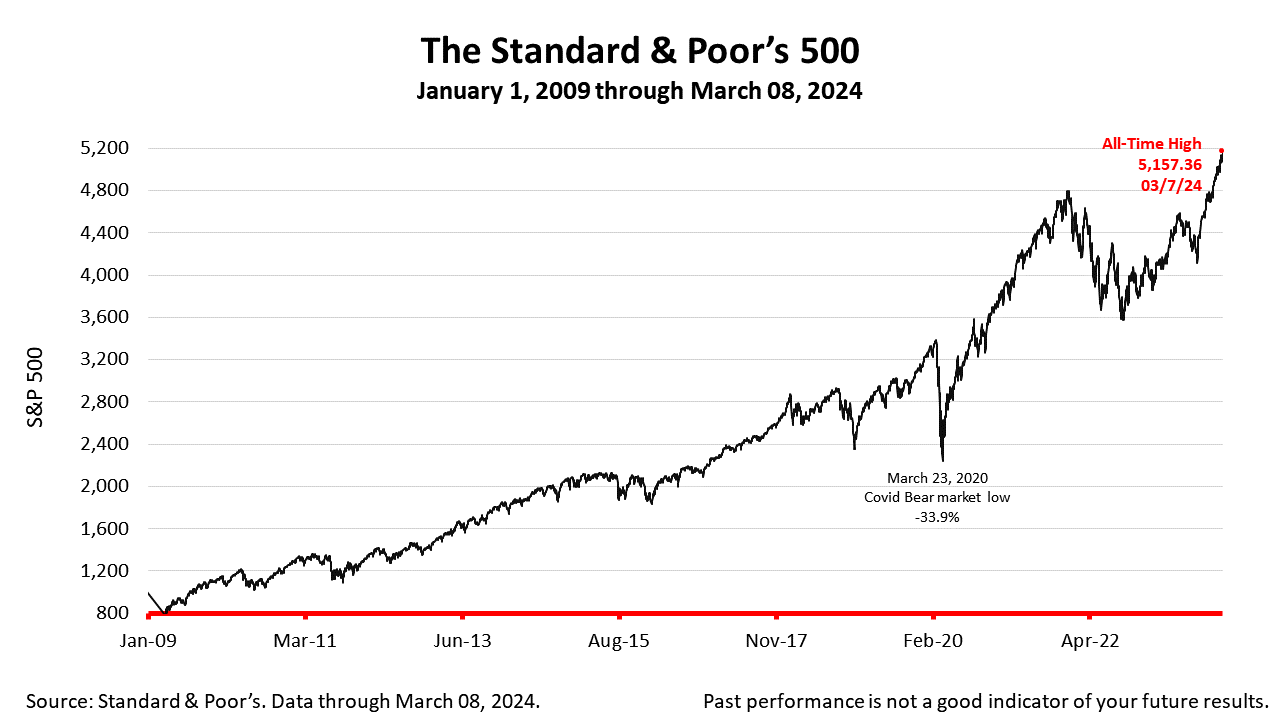
The Standard & Poor’s 500 stock index closed at a new all time high on Thursday, March 7, 2024, before closing lower by 0.65% on Friday at 5123.69. The stock index declined -0.26% from a week ago. The index is up +129.00% from the March 23, 2020, bear market low.
The Standard & Poor's 500 (S&P 500) is an unmanaged group of securities considered to be representative of the stock market in general. It is a market-value weighted index with each stock's weight proportionate to its market value. Index returns do not include fees or expenses. Investing involves risk, including the loss of principal, and past performance is no guarantee of future results. The investment return and principal value of an investment will fluctuate so that an investor's shares, when redeemed, may be worth more or less than their original cost. Current performance may be lower or higher than the performance quoted.
Nothing contained herein is to be considered a solicitation, research material, an investment recommendation, or advice of any kind, and it is subject to change without notice. Any investments or strategies referenced herein do not take into account the investment objectives, financial situation or particular needs of any specific person. Product suitability must be independently determined for each individual investor. Tax advice always depends on your particular personal situation and preferences. You should consult the appropriate financial professional regarding your specific circumstances. The material represents an assessment of financial, economic and tax law at a specific point in time and is not intended to be a forecast of future events or a guarantee of future results. Forward-looking statements are subject to certain risks and uncertainties. Actual results, performance, or achievements may differ materially from those expressed or implied. Information is based on data gathered from what we believe are reliable sources. It is not guaranteed as to accuracy, does not purport to be complete, and is not intended to be used as a primary basis for investment decisions. This article was written by a professional financial journalist for Advisor Products and is not intended as legal or investment advice.
This article was written by a veteran financial journalist based on data compiled and analyzed by independent economist, Fritz Meyer. While these are sources we believe to be reliable, the information is not intended to be used as financial advice without consulting a professional about your personal situation. Indices are unmanaged and not available for direct investment. Investments with higher return potential carry greater risk for loss. Past performance is not an indicator of your future results.
2024
-
 Stocks Closed At A Record High
-
 Federal Reserve Projects Strong Growth
-
 The Best People Were Wrong
-
 This Week’s Investment News In Six Charts
-
 U.S. Investor Picture Of The Week
-
 The Conference Board Backs Off Its Recession Forecast
-
 Softening Economic Data, Inflation Fears Dampen Stock Rally
-
 S&P 500 Closes Above 5000 For The First Time Ever
-
 Why America Is The World’s Economic Leader
-
 Investment News For The Week Ended Friday, January 26
-
 Why Stocks Broke The All-Time Record High
-
 A Strategic Update, With Stocks Near All-Time High And Crises Unfolding


")