With Stocks Near All-Time High, Personal Income And Employment Data Are Released


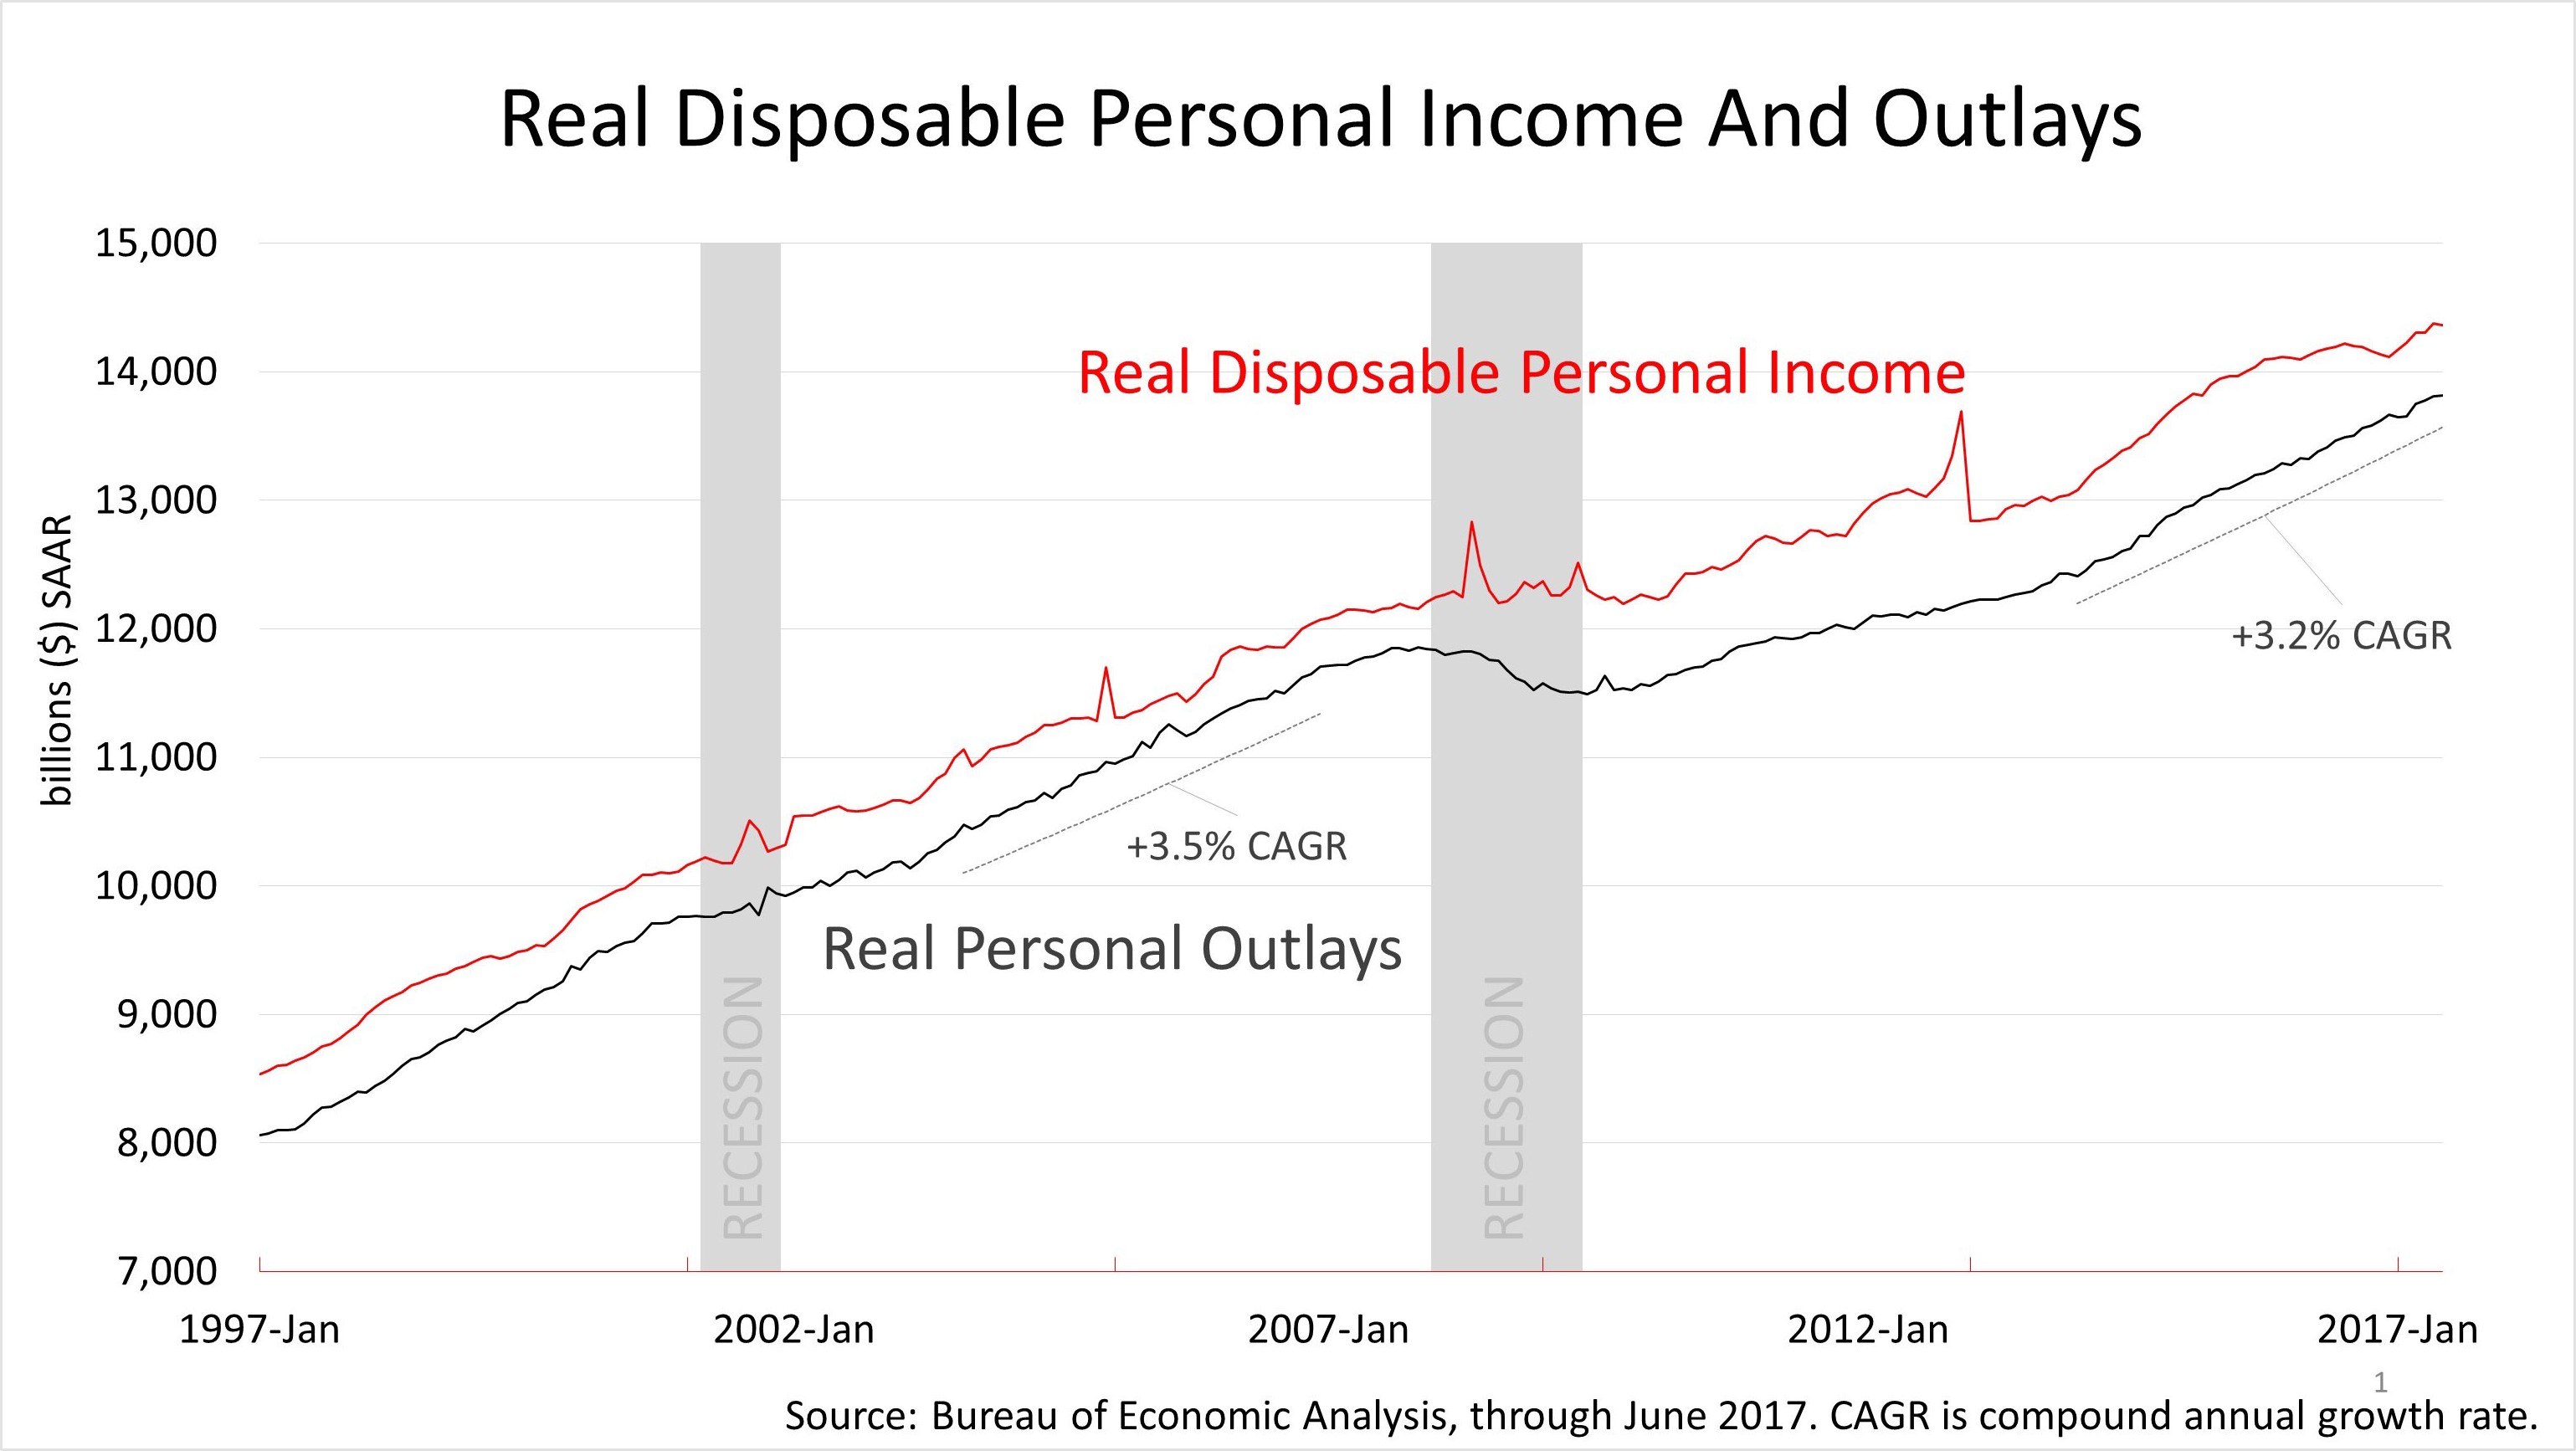
Real disposable personal income grew 2.8% in the 12 months ended June 30. That's the same rate as in the last economic expansion and is enough to fuel continued economic growth.
Real disposable personal income is a key figure in driving the economy because it is the key determinant of consumer spending and 70% of U.S. growth comes from consumer spending.
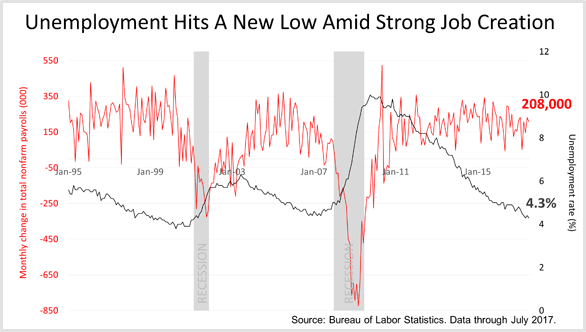
Meanwhile, the official unemployment rate declined to 4.3%. That's lower than the bottom of 4.4% in the rate of joblessness achieved in the last economic expansion in spring 2007.
Not since May 2001 has the unemployment rate been this low, and that was at the end of the longest expansion in modern U.S. history.
In addition, the economy has continued to create new jobs - 208,000 of them in June - which was above expectations.
New job creation and a decline in unemployment has been stretched out because the severity of The Great Recession caused more job losses than in past recessions.
The economy cannot keep producing new jobs the way it has in recent years because the U.S. is at full employment, or near it. When companies find that their new positions cannot be filled or take much longer to be filled, they continue to operate but with open positions. However, companies eventually are likely to stop creating new jobs when they cannot fill their current openings. This is likely to happen in the months ahead.
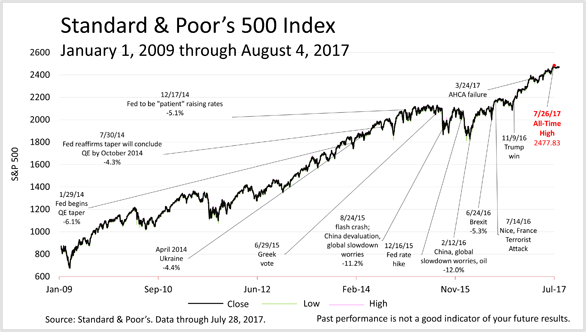
The Dow Jones Industrial Average closed above the 22,000 mark for the first time ever on Wednesday, August 2. The Standard & Poor's 500 index has repeatedly broken its all-time high for months and it closed the week fractionally lower than its all-time high.
At 98 months, the current expansion and bull market is the third-longest in modern U.S. history, and the good times could surpass the longest-ever U.S. expansion, the 120-month-long boom that spanned the entire decade of the 1990s and ended with the tech bubble of early 2000.
A bad surprise could turn sentiment abruptly, and a 10% or 15% price drop is possible any time. However, earnings on the Standard & Poor's are expected by Wall Street analysts to rise by 18% in 2017 and 12% in 2018 - far stronger than the long-term annual average rate of earnings growth of 7%, and the latest economic data released this past week bolstered expectations for continued economic growth, indicates, which drives corporate earnings, so the bull market could also go on for years.

Combined with the one-two punch of tax and financial planning, adhering to a discipline of broad diversification and strategic asset allocation in a low-cost core portfolio that is periodically rebalanced is a smart regimen to prepare for the best of times and worst.

We are independent financial professionals, communicating at a frequency attuned to you.
Get financial wisdom here anytime from your Smartphone, by subscribing to our e-mail newsletter.
© 2024 Advisor Products Inc. All Rights Reserved.
More articles
- How Strategic Asset Allocation And Rebalancing Worked In The 12 Months Ended June 30
- Wall Street's "Top" Strategists' Recommendations Are Like Monkeys Throwing Darts
- Five Documents At The Core Of An Estate Plan
- 10 Common Questions On Social Security Benefits
- Plan For Retirement At Different Stages Of Life
- Are You Still On Target For A Secure Retirement?
- Stronger Than Expected Jobs Creation But CNBC Reports "Trouble Lurked"
- S&P 500 Returned 2.9% In 2nd Quarter And 9.2% In First Half Of 2017
- Despite Distractions, Demographics Are Poised To Drive U.S. Long-Term Growth
- Live Longer And Prosper In Your Golden Years
- The Federal Reserve's Historic Economic Experiment Entered A New Phase
- Despite The Washington Sideshow, Stocks Closed At A New All-Time High
- Confronted By Major Political Crisis, The U.S. Financial System Barely Blinked
- 5 Ways That Can Help You Pay For Higher Education
- Passing Down IRA Assets? Clue In Family Members